AI App Builder Analytics (2026): Three Products, One Word
Every AI app builder says it has analytics. Three genuinely different products share the word: one measures your bill, one measures that people arrived, and one measures what they actually did. Eight builders compared on which you get, whether it records events, and how long the data survives.
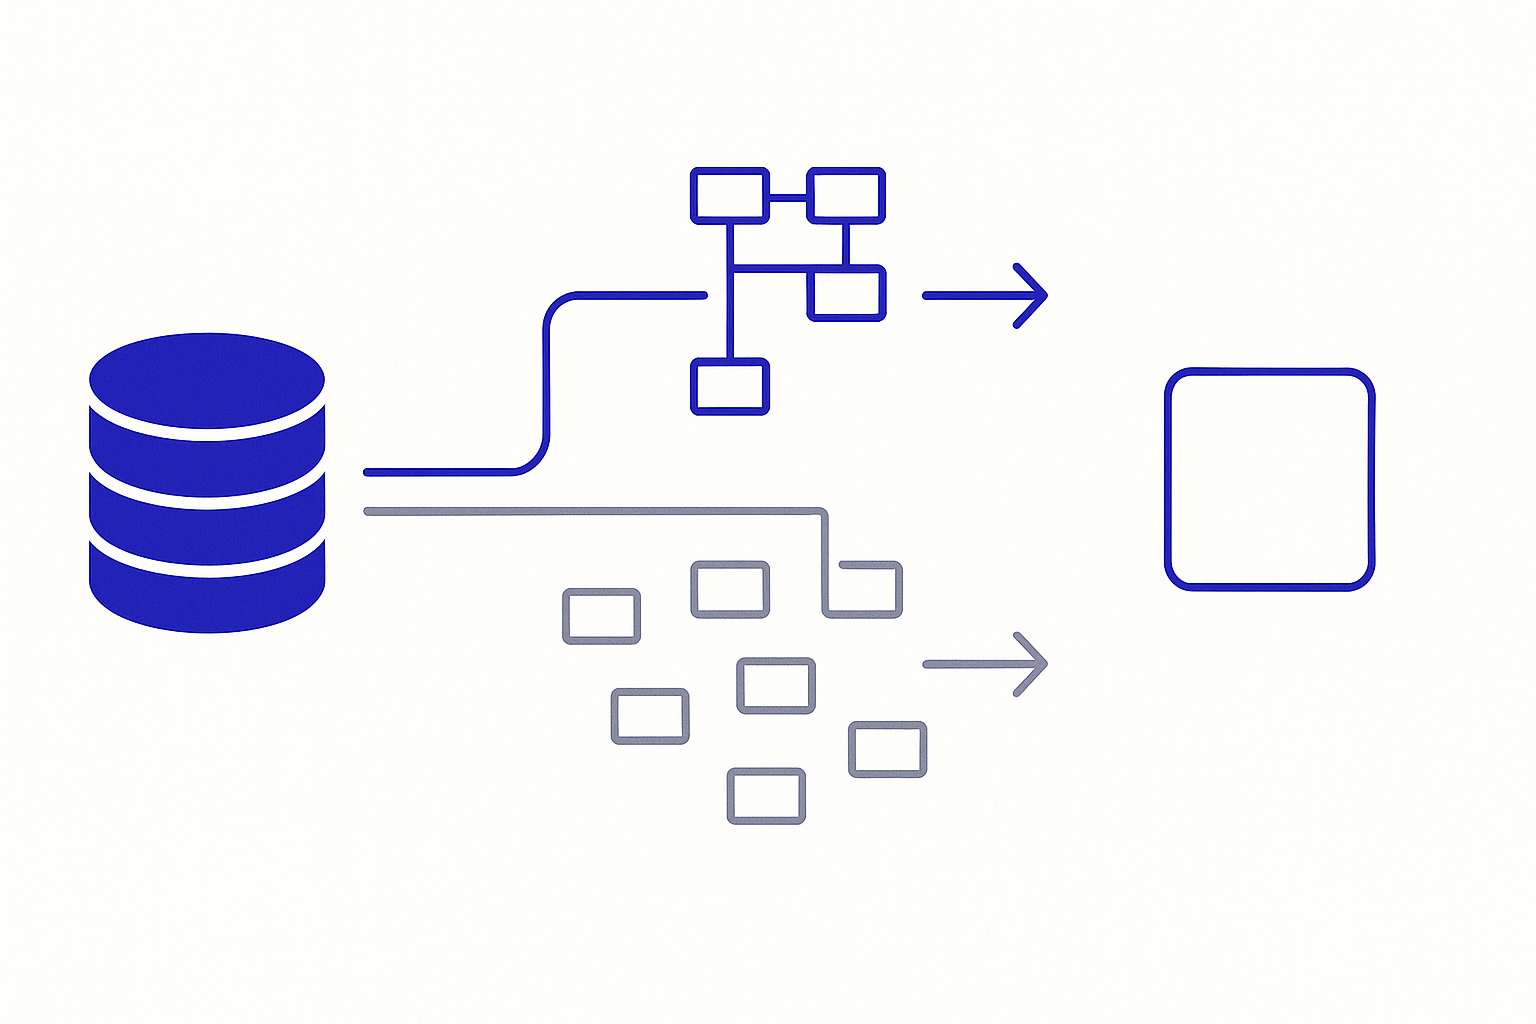
Three separate abstract measurement instruments on individual platforms, a bar chart, a line graph and a scatter cluster, representing three different products sold under the single word analytics
On this page
Quick Answer
Every builder here will show you a chart. The problem is that three genuinely different products are sold under the same word, and the vendors know it: Lovable's own analytics page carries a note disambiguating three of its own features by name, and Replit files app visitor data under Growth while reserving the word "Analytics" for a billing dashboard.
The three are: operator analytics (what your app costs you), traffic analytics (that people arrived), and product analytics (what those people actually did). Almost every built-in tool in this category is the middle one. Only one platform ships the third natively.
Base44 is the only builder here with real product analytics out of the box. base44.analytics.track() records custom events with your own properties, and a beta Apps API reads them back with filters, time buckets and breakdowns. It also has the shortest memory, and its two documentation pages do not state retention the same way.
Webflow has the most complete built-in analytics product, including click goals, clickmaps and CSV export, and it is the only vendor here that has published a dated correction admitting it had been over-counting unique visitors.
Lovable gives you traffic analytics with zero setup, and says plainly what it will not do: it "does not build profiles of your visitors or follow them across separate visits", and it does not read UTM parameters.
Bolt.new is the most honest about a problem the others do not mention. Its documentation states that its analytics counts bots, and that there is no built-in way to separate crawler traffic from real people.
Replit has three separate panes that each answer a different question, and the one actually called Analytics is the one least likely to be what you want.
Bubble counts page loads, but as billable workload rather than audience. For audience you install a plugin.
Softr does not publish a first-party dashboard at all. It documents integrations, and hands the data to your own accounts.
v0 has no analytics primitive of its own. Traffic insight comes from Vercel Web Analytics on your own Vercel project.
If you need to answer "did the people who signed up last week ever come back and finish onboarding", only Base44 answers it natively, and only for as long as it keeps the events.
Why "does it have analytics" is the wrong question
Ask a builder whether it has analytics and the answer is always yes. The word is doing too much work.
Sort the dashboards by the question they answer and they fall into three piles that barely overlap.
The first pile measures you. Replit's Analytics Dashboard is "available exclusively for Enterprise customers" and reports active members, collaboration activity, resource consumption by member and by app, and spending against budgets. Bubble's App Metrics is explicitly a workload tool: it describes workload as "the sum of all the work performed", and its metric categories are things like Scheduled API Workflows, Real-time Search, File Uploads and Page Load, each drillable down to the individual expression responsible. v0's plan table lists "Usage Analytics" one row below "Shared Credit Pool" and "Centralized Billing". Lovable's Insights answers "how much does my workspace build, and who uses what it builds". These are finance and capacity-planning instruments wearing an analytics label.
The second pile measures arrival. Visitors, page views, sessions, referrers, countries, devices. This is what most builders mean when they say analytics, and it is genuinely useful for the question "did that launch post work".
The third pile measures behaviour: named events with properties you choose, tied to a user and a session, queryable after the fact. This is the pile that tells you whether your product works, and it is nearly empty.
The gap matters because the questions people actually have are behavioural. Which step of onboarding loses people. Whether the users who hit the paywall came back. Whether the feature you shipped last month gets touched. Traffic analytics cannot answer any of those, no matter how many charts it draws.
Axis 1: which of the three you are being sold
The one platform that ships behaviour natively
Base44 is alone here. Its SDK exposes base44.analytics.track(), which takes an event name and an arbitrary property bag, and the documented examples are exactly the shapes you would want: purchase_completed with a product id, amount and currency, or feature_used with a feature name and an export format. On top of that it tracks initialization, periodic heartbeats and session duration automatically, which it describes as measuring engagement "without manual instrumentation".
The dashboard side surfaces visits, unique visitors, visit duration and a live visitor count, plus cards for pages, locations, arrival paths, operating systems, devices "and any custom events or properties you decide to track". So the events you send are not write-only.
The dashboards that measure arrival
Lovable's Project analytics is the smoothest of these. It "starts collecting automatically when you publish your project, with nothing to set up", and reports visitors, page views, views per visit, visit duration and bounce rate, plus a live counter of people active in the last five minutes. Breakdowns cover source, page, device and country, though country is derived from the visitor's browser time zone rather than an IP lookup.
Replit's equivalent is the Growth pane, and the naming is the trap. Growth answers "are people finding and using the app" with visitors, top pages, referrers, countries, browsers and devices. A separate Monitoring pane answers a different question entirely, reporting requests, HTTP statuses, response durations, CPU utilization and memory utilization. Neither is the thing Replit calls Analytics.
Bolt Hosting includes analytics on a paid plan, covering unique visitors, pageviews, top pages, bandwidth, traffic sources, visitor locations and, usefully, a list of top "not found" pages so you can see what people expected to exist.
Webflow Analyze is the most developed built-in product in the comparison, but it is a paid add-on bought separately by a Workspace admin. It captures click events, unique visitors, sessions, bounce rate, time on site and time on page, and audience attributes. It also reaches into territory nobody else here documents: clickmaps, audiences, goal reporting with conversion rates, and an AEO suite that reports which LLM bots crawl your site and how AI-referred visitors behave once they arrive.
The platforms that hand the job to somebody else
Softr documents no first-party dashboard. What it documents is plumbing: paste a Google Analytics ID under Settings, Integrations, Google Analytics; the same for Google Tag Manager; the same for Microsoft Clarity, which brings heatmaps and session replays.
v0 is the cleanest version of this posture. Project settings expose an Analytics entry whose description is "Enable Vercel analytics for project traffic insights", and the docs point at Vercel Web Analytics and Speed Insights. The data lands on your Vercel project.
Bubble sits in both piles. App Metrics is a genuine first-party dashboard that measures workload, and for audience it ships plugins for Google Analytics and Mixpanel.
Delegation is not a weakness. A tool you own outlives the builder, keeps its own retention, and is not something you lose in a migration. It is simply a different deal, and it needs to be a deliberate one.
Axis 2: whether it can tell you what a user did
Events are the dividing line
The technical difference between the second and third pile is whether you can name a thing that happened and attach your own data to it.
Base44 lets you do that directly. Webflow gets closest among the rest through goals, which track clicks on specific buttons and forms and report a conversion rate across the site. That is a constrained event model, but it is a real one: you are declaring an action that matters and measuring completion, rather than reading a page-view count and guessing.
Everyone else in the built-in pile counts arrivals. You can infer behaviour from page sequences if your app has distinct URLs per step, and many do not.
The platform that tells you it will not follow a person
Lovable states the limit rather than leaving you to discover it. Its analytics documentation says the feature "measures overall traffic, not individual people", and that Lovable "does not build profiles of your visitors or follow them across separate visits".
Read as a privacy posture that is a deliberate and defensible choice. Read as a capability statement it is decisive: a tool that does not connect a visitor across sessions cannot answer a retention question, ever, regardless of how long you leave it running.
The same page names the escape hatch. For "campaign or funnel reporting", it points you at PostHog, which Lovable supports as an integration for capturing product analytics events, evaluating feature flags and sending server-side events.
Definitions differ enough to change the number
Nobody counts the same way, and the differences are documented rather than hidden.
Webflow warns that a unique visitor "may be counted more than once if they return using a different browser or device", and defines a session as ending after 30 minutes of inactivity. Lovable's Insights defines a visit as one person opening a published app and adds that "the same person returning later counts as another visit, so visits do not count unique people". Base44 distinguishes total visits from unique visitors explicitly, and derives its live-user figure from heartbeats in the last two minutes rather than from events.
None of that is wrong. It does mean that moving between two of these platforms, or comparing a built-in number against a bolted-on one, will produce a step change in your metrics that reflects nothing about your app.
Axis 3: how long the data lives, and whether you can take it out
Retention is shorter than people expect
This is the axis most likely to bite, because it is invisible until the day you want a year-over-year comparison.
Base44 documents retention in two places and the two statements do not obviously reconcile. The app analytics page ties history to your plan: 7 days on Free, 30 days on Starter and higher, 365 days on Enterprise. The Apps API page states a flat rule instead, that "Base44 deletes an analytics event 60 days after it happened", and that a time range starting earlier "comes back empty rather than partial". Both are current vendor documentation. Treat the shorter figure that applies to you as the planning number until the vendor reconciles them, and note that the API page gives the right advice either way: "read the aggregates you need on a schedule and keep them yourself".
Bolt documents a 30 day ceiling on what you can view.
Where you have bolted on your own tool, retention becomes that tool's problem and that tool's plan, which is one of the better arguments for doing so.
Export is partial where it exists at all
Webflow has the most export surface and is candid about its edges. You can export charts and tables to CSV from the site overview, an individual page or an individual goal, and the file reflects your current view including the selected date range. The caveat is stated plainly: "If you hover over a chart and the export option isn't available, that chart doesn't support export to CSV yet." So it is a per-chart download, not a data dump. Webflow separately documents exporting Analyze data to a data warehouse.
Base44's Apps API is the strongest programmatic access here: list the event names an app has recorded, list the property keys each one carries, query raw rows with filters and paging, aggregate over time buckets, and rank by any field. It is in beta, and its endpoints and responses may change.
Lovable's CSV export belongs to Insights, not to Project analytics, and it exports the app list and the builder list rather than traffic history.
The others document no export of built-in analytics data, which is the expected answer for platforms whose position is that you should bring your own tool.
Analytics history is the thing that never migrates
Everything else in an app has some migration path. Schema and rows can be dumped and reloaded, as we cover in what happens to your database when you leave. Source code can be exported. Files can be re-uploaded, slowly.
Analytics history has none of that. There is no import endpoint on any of these platforms, because nobody wants to accept a competitor's visitor counts as fact. So the history is not portable in the ordinary sense: it is either exported into a format you keep yourself, or it ends at the moment you switch.
That makes analytics a quiet contributor to the switching cost that the wider lock-in picture is made of, and an unusual one, because the cost grows the longer you stay and the better things go. A month in, you lose nothing. Two years in, you lose the only record of what your product did before you changed it.
The mitigation is boring and it works. If your analytics matters, own it from the start, either by running a tool on your own account or by exporting aggregates on a schedule into somewhere you control. Both are cheap while the data is small.
The comparison table
Scroll to see more
Builder
Built-in analytics
Custom events
Documented retention
Export
Third-party route
Base44
Traffic plus product analytics
Yes, analytics.track()
7 / 30 / 365 days by plan, and a separate 60 day event-deletion rule
Apps API, in beta
Not required
Webflow
Analyze, a paid add-on
Click goals only
Not stated in the pages reviewed
Per-chart CSV, plus data warehouse
GA4, GTM
Lovable
Yes, automatic on publish
No
Up to 90 days selectable
Insights CSV, app and builder lists only
GA4, PostHog
Bolt.new
Yes, on a paid plan
No
30 days viewable
Not documented
Paste GA or Matomo code
Replit
Growth pane, basic metrics
No
Not stated in the pages reviewed
Enterprise usage reports
Not documented as first-class
Bubble
App Metrics, workload only
Via your GA account
30 days by default in App Metrics
Not documented for App Metrics
GA plugin, Mixpanel plugin
Softr
None documented
Via your own tool
Your tool's retention
Your tool's export
GA, GTM, Microsoft Clarity
v0
None of its own
Via your own tool
Your Vercel plan's retention
Your Vercel project
Vercel Web Analytics
Read the "custom events" column first. It is the one that separates a tool that can answer a product question from a tool that can only tell you a launch worked.
The details that decide whether it works at all
Bots are in the numbers, and one vendor says so. Bolt's documentation states that its analytics "includes visits and actions from web crawlers and bots", that "there is no built-in way to separate crawler traffic from visits by real users", and that reported metrics "may be higher than actual human activity". This is the single most useful sentence any of these vendors publishes about analytics, and it is almost certainly not unique to Bolt. Treat any built-in visitor count on a low-traffic app as an upper bound.
One vendor has already restated its own history downward. Webflow published a note explaining that Analyze had been counting unique visitors and sessions for multi-day ranges by adding up daily counts, so a visitor returning on several days was counted several times. It now counts each visitor once across the selected range, and warns that "historical numbers are lower than before". The day-by-day graph is unchanged and billing is unaffected. Publishing that is good practice, and it is also a reminder that a number in a dashboard is a methodology, not a fact.
Nothing collects until you publish. Lovable only collects while the project is published. Bubble requires a deploy before the tracking ID is live. Webflow requires you to turn tracking on and then publish. Replit notes that analytics populate only after the published app receives traffic. Every one of these is an obvious source of "the tracking is broken" panic on day one.
Consent handling is your problem, and it can silently zero the data. Webflow offers always-on, opt-in and opt-out tracking, and states that the opt-in and opt-out modes "require a consent management solution to function properly". Bubble's guidance is more pointed: configure the app not to store cookies by default and "your Google Analytics integration will not pass data through when a user cookie is unavailable". That is correct behaviour and it means a compliant configuration and an empty dashboard look identical.
Two vendors still document a Google product that no longer exists. Both Bubble's and Softr's Google Analytics pages walk you through Universal Analytics setup, including copying a tracking ID "beginning with UA". Google's own timeline states that standard Universal Analytics properties stopped processing hits on July 1, 2023, and that from the week of July 1, 2024 users lost access to current and historical UA data and to the interface and API. Follow the GA4 branch of those pages and ignore the UA branch.
Base44's query API has two sharp edges worth knowing before you build a report on it. Its regex filter operator matches a substring rather than a regular expression, so ^ and .* match literally. And a property key containing a space, a hyphen or a leading digit is recorded and returned by the properties endpoint but cannot be filtered or aggregated on, which means a naming mistake made in the app is only discovered later, in the reporting layer.
Check which pane you are looking at on Replit. Growth, Monitoring and the Enterprise Analytics Dashboard answer three different questions, and only the third carries the word Analytics.
Verdict, September 2026
If you need product analytics natively, Base44 is the only builder here that ships it. Named events with your own properties, automatic session and heartbeat tracking, and a query API that reads them back. Budget for the retention window and export aggregates on a schedule, because the vendor's own documentation tells you to.
If you want the most capable built-in analytics and are willing to buy it separately, Webflow Analyze is the most developed product in this comparison, and the only one here with clickmaps, goal conversion reporting, CSV export and LLM-bot reporting. It is an add-on, so treat it as a decision rather than an included feature.
If you want traffic numbers with zero effort, Lovable is the best of the automatic tools. It turns itself on at publish, it is readable, and it is honest about the ceiling: it will never tell you what an individual did across visits.
If you are on Bolt, Replit, Bubble, Softr or v0, plan to bring your own tool. What they give you is arrival data of varying depth, and in Bubble's case a workload meter that is not about your audience at all. That is not a failing so much as a different split of responsibility.
The general rule that survives whichever platform you pick: built-in analytics on an app builder is a traffic tool with a short memory, and the moment your question becomes behavioural or historical you will be reaching for something you own. Deciding that up front is cheaper than discovering it when the window you needed has already been deleted.
Sources
All claims verified against primary vendor documentation on September 7, 2026.
Lovable, "Project analytics" and "Insights", docs.lovable.dev, 2026
Lovable, "Connect your app to PostHog" and "Connect your app to Google Analytics", docs.lovable.dev, 2026
The Builderdex editorial desk builds structured, criteria-based comparisons of AI app builders. We test every claim against primary vendor documentation and publish the source for each one.
Frequently asked questions
Do AI app builders come with analytics built in?
Most do, but usually only traffic analytics: visitors, page views, sources and devices. Lovable, Bolt, Replit and Webflow all ship a built-in traffic dashboard. Only Base44 ships product analytics natively, meaning named events with your own properties. Softr and v0 publish no first-party dashboard and expect you to connect your own tool.
Which AI app builder lets me track custom events?
Base44 is the only one here with a native custom event API. Its SDK exposes base44.analytics.track(), which takes an event name and arbitrary properties, and a beta Apps API reads those events back with filters, time buckets and breakdowns. Webflow gets closest among the others through goals, which track clicks on specific buttons and forms.
How long do AI app builders keep analytics data?
Shorter than most people expect. Bolt documents a 30 day viewing window. Base44 documents retention in two places that do not obviously reconcile: its app analytics page ties history to plan at 7, 30 or 365 days, while its Apps API page states events are deleted 60 days after they happen. Lovable lets you select periods up to 90 days. If history matters, export aggregates on a schedule.
Can I export analytics data out of an AI app builder?
Partially. Webflow exports individual charts and tables to CSV reflecting your current date range, and notes that some charts do not support export yet. Base44 offers a beta Apps API for programmatic reads. Lovable's CSV export belongs to Insights and covers the app and builder lists rather than traffic history. The others document no export of built-in analytics data.
Do built-in analytics count bots?
At least one vendor says so explicitly. Bolt's documentation states that its analytics includes visits and actions from web crawlers and bots, that there is no built-in way to separate crawler traffic from real users, and that reported metrics may be higher than actual human activity. Treat any built-in visitor count on a low-traffic app as an upper bound.
Why do two builders report different visitor numbers for the same app?
Because the definitions differ and are documented differently. Webflow warns a unique visitor may be counted more than once if they return on a different browser or device, and ends a session after 30 minutes of inactivity. Lovable's Insights counts a returning person as another visit and states that visits do not count unique people. Webflow has also published a correction reducing historical unique visitor totals after changing how multi-day ranges are calculated.
Is it better to use the built-in analytics or connect Google Analytics or PostHog?
Connect your own tool if your questions are behavioural or historical. A tool on your own account keeps its own retention, survives a platform migration and answers funnel and cohort questions that traffic dashboards cannot. Built-in analytics is convenient for checking whether a launch drove traffic. Note that analytics history has no import path anywhere, so it is the one thing that never migrates.
A 2026 scorecard of vendor lock-in across six AI app builders, scored on five independent layers: code, data, identity, runtime, and what the exit itself costs. Your migration bill is set by your weakest layer, not your average.
A criteria-based 2026 scorecard of database portability across six AI app builders: v0, Bolt.new, Lovable, Replit, Base44, and Bubble. Whose account holds the data, who gives you a connection string, and why a CSV export is not the same as a portable database.
Asking whether an AI app builder has payments tells you nothing about whether it can run a marketplace. One collects money into your account, the other has to move it past you to a seller. Eight builders compared on documented marketplace paths, Stripe Connect and the money split.